|
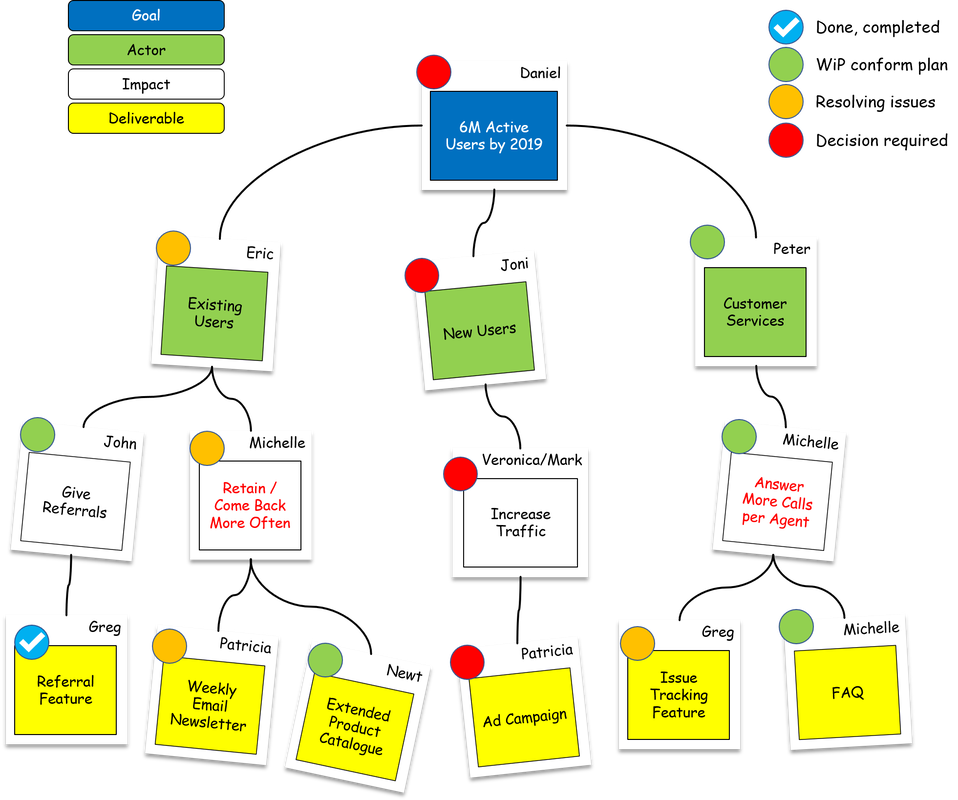
By: Dennis van der Spoel Whether you are using a silo or a value stream approach to portfolio management, strategic alignment remains a major challenge. In the silo-oriented project portfolio management-approach, this is often due to segmentation of budgets and accountabilities. In lean-agile product / project portfolio management this is due to the focus on the short-term value of initiatives. In both cases, benefit mapping offers a solution. In silo-based portfolio management, benefit mapping helps to align and prioritize all initiatives across the silos. In lean-agile portfolio management, benefit mapping helps to discover and communicate the near-term business value of potential epics. The Issues with Portfolio Management when Funding SilosEvery fall the ceremonies to define the organizational and departmental budgets for next year are the same. Each cost-center creates a spreadsheet of their forecast of next year’s income and expenses. Usually, these include revenues, wages, overhead, IT, and training. About 80 percent of the expenses is earmarked for business as usual. About 20 percent is reserved for planned change initiatives. And the total budget should preferably be within a 5 percent deviation from last year’s budget to avoid intense debate. Project budgets are purely fictional in this setting. The silos (a.k.a. the verticals) are funded, while individual change initiatives (a.k.a. the horizontals) compete for resources across silos throughout the year because reality didn’t stick to the plan. The result is that every sponsor will start his/her project as early as possible to prevent having their project falling prey to scrutiny, budget cuts, or reallocations later in the year. This clogs the delivery pipeline and often reduces flow by as much as 70 percent. And because parts of the annual budget are reserved for - but not allocated to - individual change initiatives, every initiative spends quite some effort on building a business case to get their initiative funded. This usually involves a substantial paper exercise where much of the content is copied and pasted from previous documents into a standard template. The result is that no one actually reads the business case or actively manages the business case throughout the lifecycle of project and product. We just spend time and money fooling each other and providing a false sense of predictability and control. Another issue is that when we create next year’s budgets, we also tend to translate our annual ambitions into a set of KPIs that cascade down the organizational hierarchy. After each BU manager and departmental head has negotiated his/her targets for next year, what usually remains are operational KPIs. Operational KPIs are focused on routines, not on change. Meeting the norms often means optimizing business as usual, not implementing change. Thus, strategy realization is slowed down. And very often, KPIs impede cooperation with other silos rather than entice it. Nobody wants to depend on the performance of others in their performance review cycle, especially when bonuses and perks are involved. So, most dependencies are removed during negotiations. Hence, strategic alignment is lost. Finally, since portfolios are bucketed or categorized following organizational divisions, there is no unambiguous management of bottlenecks in the delivery pipeline, resulting in a huge amount of Work-in-Progress and a sharp decrease in throughput. The effect is that cycle times are being measured in months and quarters rather than days or weeks, if measured at all. The Issues with Portfolio Management when Funding Value StreamsIn Value Stream Portfolio Management, there is no distinction between business as usual and change. Change has become business as usual. It’s just chunks of work that come to the teams, that are split into bit-size pieces and then prioritized and delivered. There simply are no traditional projects or programs anymore. Every quarter a group of senior managers decides how much money to allocate to each strategic intent and/or value stream. This translates directly into the number of cross-functional teams that will be working on that strategic intent and/or value stream. So, the intent and the cross-functional teams (a.k.a. the horizontals) get funded, not the silos (a.k.a. the verticals). As a result, teams remain reasonably stable and will increase performance over time. Since budget allocation is no longer an issue, and capacity is fixed for the next quarter, the purpose of the business case changes. We no longer need to make an investment decision. All we need to do is to prioritize the work. That is exactly the purpose of the lean business case. An initiative, often called an epic, now only needs a lightweight business case, or even just a benefit hypothesis, that enables us to continuously compare initiatives to each other for prioritization. While this solves the problems we encounter in traditional portfolio management, it also introduces new impediments. The first one is related to the traditional urge to control spending and returns in a predictable manner. How do we decide which strategic themes and value streams to fund; and to what extent? And how do we estimate and measure the ROI at this level of granularity? Second, if we use MoSCoW or WSJF-prioritization to plan and deliver work, how do we ensure that all stakeholders are satisfied with the outcomes? These prioritization methods and the frameworks used often lead to a focus on short-term value delivery for a specific subset of stakeholders. And while that is not a bad thing in itself, we tend to undervalue the things we need to do now to remain relevant in the future. How do we correctly assess the business value of work items that do not have an immediate effect upon delivery? How do we move towards our ‘Blue Ocean’ when all organizations focus on improving their responsiveness to evolving needs of the same customer-base? Another question when using lean and agile approaches is where do the epics and features come from? In most frameworks they magically appear somehow in collaboration with stakeholders. But how? Free-form brainstorms undermine strategic alignment, while design sprints or the lean startup approach take a short-term perspective. Valuable though they are, they do not increase long(er)-term competitiveness. And finally, most agile teams are result-oriented and focus on the delivery of output (e.g. features, products, processes, architecture). But value is not about the stuff we make or buy; it’s about the impact we make. So, how do we become more outcome-oriented? Visualizing causalityI have used many different causality diagrams over the years, ranging from Ishikawa’s Fishbone Diagram to Goldratt’s ToC Thinking Processes (Current Reality Tree, Evaporating/Conflict Cloud Diagram, Future Reality Tree, Transition Tree, Prerequisite Tree) and Kaplan and Norton’s Strategy Maps. However, the most useful diagrams for driving change I have found to be Benefit Maps and Impact Maps. Both techniques can be kept simple, focus on impact to be made, create strategic alignment, foster cooperation, and help discover deliverables and changes to the way of working to put on the backlog. Impact maps differ from benefit maps in the sense that impact maps are stakeholder oriented (outside-in, benefits for our stakeholders) while benefit maps are centered around our own ambitions (inside-out, benefits for us). Where a benefit map focuses on changes to our own way of working and the enablers required, the impact map focuses primarily on discovering key functional requirements to impact the stakeholder’s way of working. Further, a benefit map also helps to visualize causality and dependencies between branches while an impact map is a more hierarchical model. That’s why they produce different results, even when using the same starting point: Therefore, a benefit map is best used to improve our organization and optimize our value streams or programs. An impact map is best used to quickly improve value propositions (products and services). Both instruments are vital in defining and refining your portfolio(s). At Dennis van der Spoel Consulting we have used both techniques when working with our clients regardless of frameworks used (e.g. Scrum, PRINCE2, AgilePM, MSP, AgilePgM, MoP, AgilePfM, SAFe, LeSS, Nexus, PMBOK, etc.) Another instrument that looks promising towards gaining a longer-term perspective is the Business Model Portfolio Map by Strategizer®. The multiplication of the Business Model Canvas combined with a SWOT-analysis is the way to go according to the latest update of Lean Portfolio Management (LPM) in SAFE. Personally, I have some doubts concerning the management of a portfolio of business models. For most organizations I know, attainment of one to three strategic objective(s) is hard enough. Managing a portfolio of future states and promising business models, each with many new strategic themes derived from SWOT-analyses, might be overwhelming. But since we have had no experience with the Business Model Portfolio Map yet, I will cover it in a later blog. What I do support is Business Model discovery through ExO Sprints. But that, again, will be food for another post. However, if you already are using SWOT, POTI or 7-S workshops successfully, any strategic objective or theme that is surfaced can be mapped using either Benefit Mapping or Impact Mapping (or both). Always keep in mind that, as an exercise, the map itself is not the goal; the objective is to attain alignment, cooperation, and flow and ultimately to ‘move the needle’ for ourselves and our stakeholders. About Benefit MappingThe benefit map clarifies the relationship between ambition, and the effects (benefits), organizational changes, and deliverables required to attain the ambition. It visualizes the benefit hypothesis for each deliverable and creates strategic alignment. Benefit mapping is a traditional program management technique first made popular by Michiel van der Molen, Gerald Bradley and Steve Jenner. This technique is an improvement to Driver Diagrams and GEM-Network Diagrams (goals/efforts/means-network diagrams). Once you have consensus about your strategic ambitions, they serve as the starting point for the Benefit Map. They also are the primary inputs to the portfolio vision and serve as elements of the economic decision-making framework for the portfolio. They affect funding and roadmaps. A benefit map:
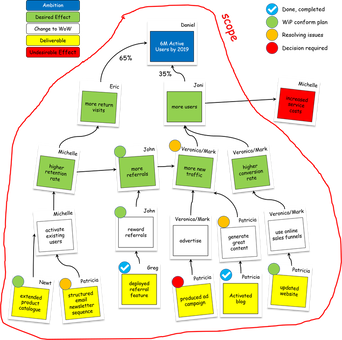
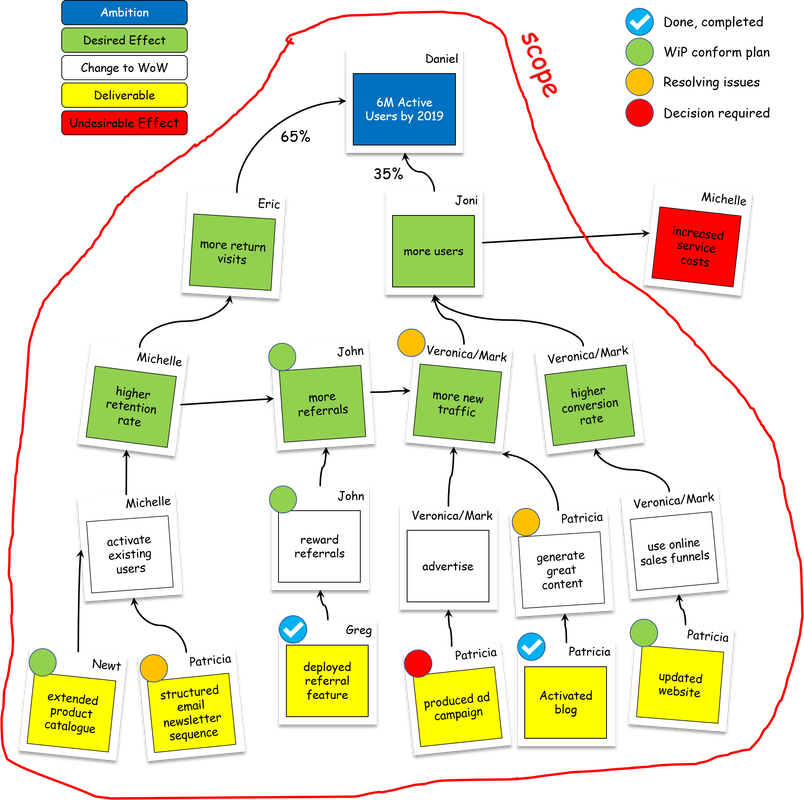
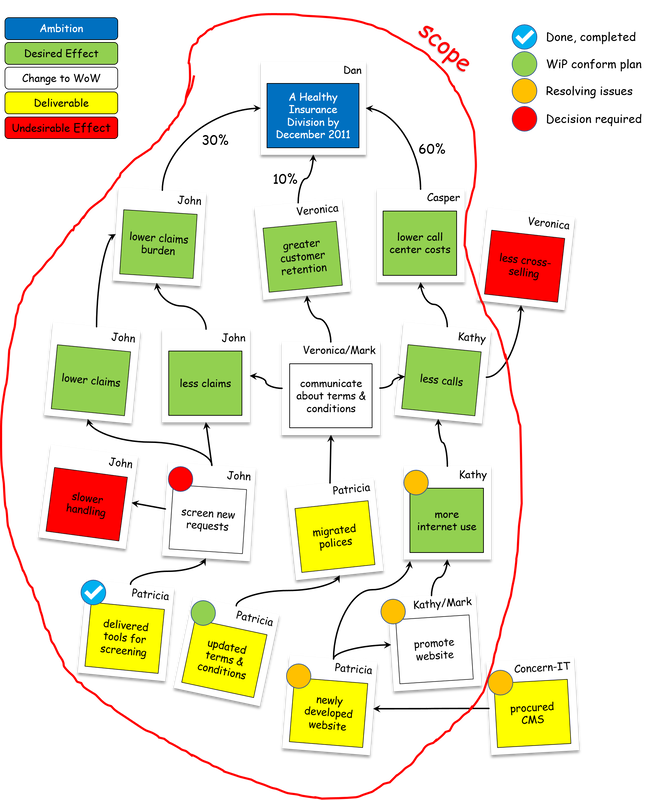
Here is an example of how a benefit map could look like: A benefit map thus is input for the portfolio backlog, the (outline/lean) business case(s) for initiatives, and for the story map(s) or work/product breakdown structure(s) of initiatives. It’s also the basis for your benefit realization plan and organizational change plan and should therefore include the names of people accountable for each item. There should also be a clear line of sight between a product/solution roadmap, the value stream map, the release / increment / tranche plan, and the relevant benefit map. Benefit maps can be cascaded; intermediate benefits on high-level maps can be used as an ambition on lower-level maps. Depending on the type and scope of the benefit map and frameworks used, a deliverable may represent the following work items:
The following reference table of work items may prove useful. However, sizes of work items may vary wildly from context to context. This table is just an example based on my own personal experience:
How to create a Benefit MapAt Dennis van der Spoel Consulting we use workshop facilitation to create Benefit Maps. We will play multiple steps. Each step represents a layer in the benefit map:
Most steps consist of multiple rounds (timeboxes):
Like all things worthwhile, the Benefit Map is created in an incremental and iterative process. Don’t go in with a first-time-right-attitude. You will always need multiple sessions to create your first map as insights will change. That is the true value of the Benefit Map; not the map itself, but the discussions and learnings the team will have while creating it. The best collective decisions are the product of disagreement and contest, not consensus and compromise. - Surowiecki So, although the timeboxes seem very short, they provide plenty of time if you suppress the urge to get it right the first time and inclination to settle all debates in the first session. The first pass should be quick and dirty. Park questions and disagreements on a flipchart to be settled later in consecutive workshops or in separate meetings. When creating your first benefit map you typically need 3 iterations / sessions spread over a 2 to 4-week period to get a robust version. However, you should have a complete map after the first session. Later sessions are used for refinement, processing feedback and backbriefing the leading indicators and norms the owners have set for their items. There also is no completed state of the benefit map, as circumstances will change over time. That’s why the benefit map should be updated at the end of each program increment (SAFe), tranche (MSP) or project stage (PRINCE2). Need Help?We provide this instruction exercise for your convenience and learning. You are welcome to use it freely to your benefit. However, we understand that there can be many reasons why using an external facilitator might smoothen the process. At Dennis van der Spoel Consulting we have extensive experience with facilitating benefit & impact mapping workshops for our clients. We have literally done this dozens of times with fantastic results. Please contact us for a quote.
0 Comments
Your comment will be posted after it is approved.
Leave a Reply. |
Archives
August 2020
Index
All
|
||||||||||||||||||||||||||||||||||||||||||||||||||||||
Services |
Company |
|
 RSS Feed